Google Spreadsheets
Spending
Track Your Spending
How to Track Your Spending with Spreadsheet (1)
Spreadsheet in Use today, we brought you the trip on how to track your spending with spreadsheet. Have you ever come across the situation that at the end of the month you run out of your money and don't know what you have spent it on. Surprisingly, you will find yourself on the same boat with many others if your answer is a yes. If you want to get out of this boat, you should now start to track your spending. There was a saying that "When it comes to your purchases, what you don't know can hurt you".
If you decide to track your spending then here is the trip to create a tool to do so with Spreadsheet with the very easy steps.
 |
| Spreadsheet in Use: How to Track Your Spending with Spreadsheet |
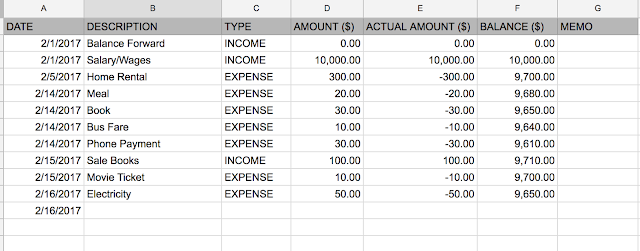
- The Date (Column A)
- Description (Column B)
- Type (income or expense) (Column C)
- The Amount (Column D)
- Actual Amount to track the sign of the amount (Column E)
- The balance (Column F)
- Optional Memo (just incase you would like to note something for reference later) (Column G)
Next, In every of column E, you will need to keep a formula "=IF(C2="EXPENSE",-1,1)*D2".
Next, In cell F1, you will need to put a formula "=E2".
Next, In cell F2, you will need to put a formula "=F2+E3" and copy this cell to past to the the next one onwards (F3, F4, F5.....).
And as the picture can paint a thousand words, you can see them in the picture above or can take a look at the real spreadsheet example at Track Your Spending with Spreadsheet.
With this step, you will see what you have spent in each month. When you look back, you can see where and what your money went to and for. Even you can't fix it in the past, but you can plan for the future.
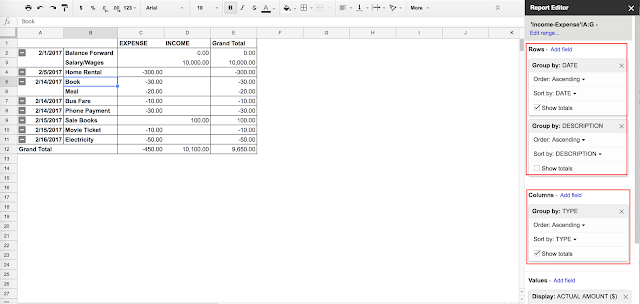
With this information we can view the information with pivot report as below:
 |
| Spreadsheet in Use: Spending Pivot Report 1 |
To create this report, go to menu Data and click at "Pivot Table" as the capture below.
 |
| Spreadsheet in Use: Create Pivot Report 2 |
Then you would be brought to the next tab with the blank report as the capture below.
 |
| Spreadsheet in Use: Create Pivot Report 3 |
Choose Date and Description for Rows, Type for for Columns, Actual Amount ($) for Values and Type in Filter and filter out Blank value.
 |
| Spreadsheet in Use: Create Pivot Report 4 |
 |
| Spreadsheet in Use: Create Pivot Report 5 |
You can check the pivot report from google sheets at Track Your Spending Pivot Report


Post a Comment